

If power quality is not visible, it cannot be managed. With SCADA integration, it is now possible to view Power Quality (PQ) data on a single screen, take rapid action during a fault, clarify maintenance plans, and automate reporting. With the right architecture and standard-compliant measurement, interruption analysis, harmonic monitoring, and alarm management become a natural part of the daily workflow.
In this article, we address the measurement rules of the IEC 61000-4-30 standard, the selection of the measurement class, practices for harmonic and interruption analysis, SCADA integration architecture, and a step-by-step test plan in a clear and applicable language. The target audience includes electrical operations, maintenance, OT, and IT teams, Organized Industrial Zone (OIZ) administrations, and distribution companies. The gains are clear: production loss drops, equipment life increases, auditing processes accelerate, and root cause analysis is simplified. Key concepts will naturally be integrated throughout the text: power quality, PQ, harmonic, interruption analysis, SCADA integration, IEC 61000-4-30, measurement class.
What is IEC 61000-4-30? The Right Data Quality with Measurement Class A, B, C
IEC 61000-4-30 defines how power quality measurements should be performed. The standard dictates which parameters should be measured in which windows and with what accuracy. Methods and reporting rules for voltage RMS, frequency, flicker, harmonics, unbalance, transient events, and interruption analysis adhere to this framework. Harmonic frequency grouping is completed with IEC 61000-4-7, and flicker measurement with IEC 61000-4-15.
Measurement classes are at three levels:
-
Class A ensures the highest accuracy and comparability. It is preferred for disputes with suppliers, auditing, and regulatory compliance.
-
Class B offers a sufficient level of accuracy for process monitoring and operational decisions.
-
Class C is suitable for basic monitoring and trend tracking.
Time synchronization is critical. Event correlation is disrupted without a reliable timestamp via GPS, NTP, or PTP. If the same event is logged at different seconds on different devices, root cause analysis is weakened. Class A devices stand out with stricter requirements for synchronization. For more technical insight into Class A measurement accuracy and scope, a practical summary is useful.
Basic PQ Parameters: Voltage, Frequency, Flicker, Unbalance, Harmonics
-
Voltage RMS: Effective value calculated over specific windows, not instantaneously. Drops are classified as sag, increases as swell. Directly affects drive and PLC behavior on production lines.
-
Frequency: Critical for production and motor performance. If the deviation increases, speed control is disrupted, and synchronous motors are stressed.
-
Flicker: The perception of light fluctuation. Calculated with an index based on human perception. References IEC 61000-4-15.
-
Unbalance: Voltage coefficient difference between phases. Leads to motor heating, efficiency reduction, and loss of bearing life.
-
Harmonics: Disturbing components at multiples of the fundamental frequency. High THD causes heating and losses in cables and transformers, and can confuse protection relays.
IEC 61000-4-30 operates with short measurement windows and statistical summaries. Operational screens often include 10-second samples and 10-minute statistical values (average, maximum, 95th percentile). This structure cleanses alarms from noise and makes reporting consistent.
Measurement Class Selection: A, B, or C?
The decision depends on the purpose, budget, and compliance requirements. Give clear answers to three questions: Whom will we compare with, what risk will we reduce, and what report will we present?
The practical table below should be your guide:
| Purpose | Recommended Class | Note |
| Dispute with supplier, official audit | A | Highest accuracy, event comparability |
| Production line monitoring and maintenance | B | Sufficient accuracy for operational decisions |
| General building monitoring, trend | C | Basic visibility, low cost |
Calibration and certification add confidence to reports. Certified calibration and time sync verification are particularly important in Class A measurements.
Time Windows and Threshold Settings in the Standard
-
RMS windows: 10/12 cycle short window, 150/180 cycle long window are common.
-
Harmonic measurement: Group/band approach over 200 ms blocks according to IEC 61000-4-7.
-
Flicker: $P_{st}$ (10-minute) and $P_{lt}$ (2-hour) values according to IEC 61000-4-15.
Incorrect thresholds generate unnecessary alarms or miss events. Reduce noise with hysteresis and minimum duration. Validate thresholds first in a pilot region.
Field Realities: Time Sync, Calibration, and Cabling
-
Time: Synchronization with GPS, NTP, or PTP is essential. Events appear in the wrong order if the clock drifts.
-
Calibration: Annually or every 1–2 years depending on usage conditions. Keep certificates archived.
-
Cabling: Shielding, grounding, CT/VT ratios, current transformer direction—all affect measurement error.
-
Configuration: Device ID, location, channel names should not be moved to live operation without being checked in the field.
For practical solutions and example applications in energy automation, this document, including RTU architecture and sector verticals, can be guiding: Energy Sector Smart Solutions PDF.
Architecture for SCADA Integration: Reliable PQ Data Flow from Device to Center
The end-to-end chain consists of the measurement device, RTU or PLC, network, data acquisition server, SCADA, database, archive, and reporting. Each link must be supported by timestamp, buffer memory, and security.
Protocols and Data Models:
-
IEC 61850: Common in substations. Responds quickly to events with object model and GOOSE, but setup is more complex.
-
DNP3: Robust for wide area and telemetry. Offers event-based reporting and sequence preservation.
-
Modbus: Simple and common. Metadata and event support are weak, requires good tagging.
-
MQTT: Lightweight and flexible for cloud data flow. Requires attention to security and identity management.
Tagging, units, and metadata standards are the backbone of the work. Add the measurement class, device ID, location, CT/VT ratio, and software version fields to the metadata. Plan for TLS or VPN for security and continuity, role-based access, IEC 62351 principles, redundant network and server, local buffering, and secure retransmission upon network recovery.
Measurement Devices and Protocols: IEC 61850, Modbus, DNP3, MQTT
IEC 61850 in the substation, DNP3 in the distributed field, Modbus at the field device level, and MQTT for cloud data output are practical choices. Prefer devices with event and timestamp support. Measurement class, calibration, and certifications should be primary criteria in device selection.
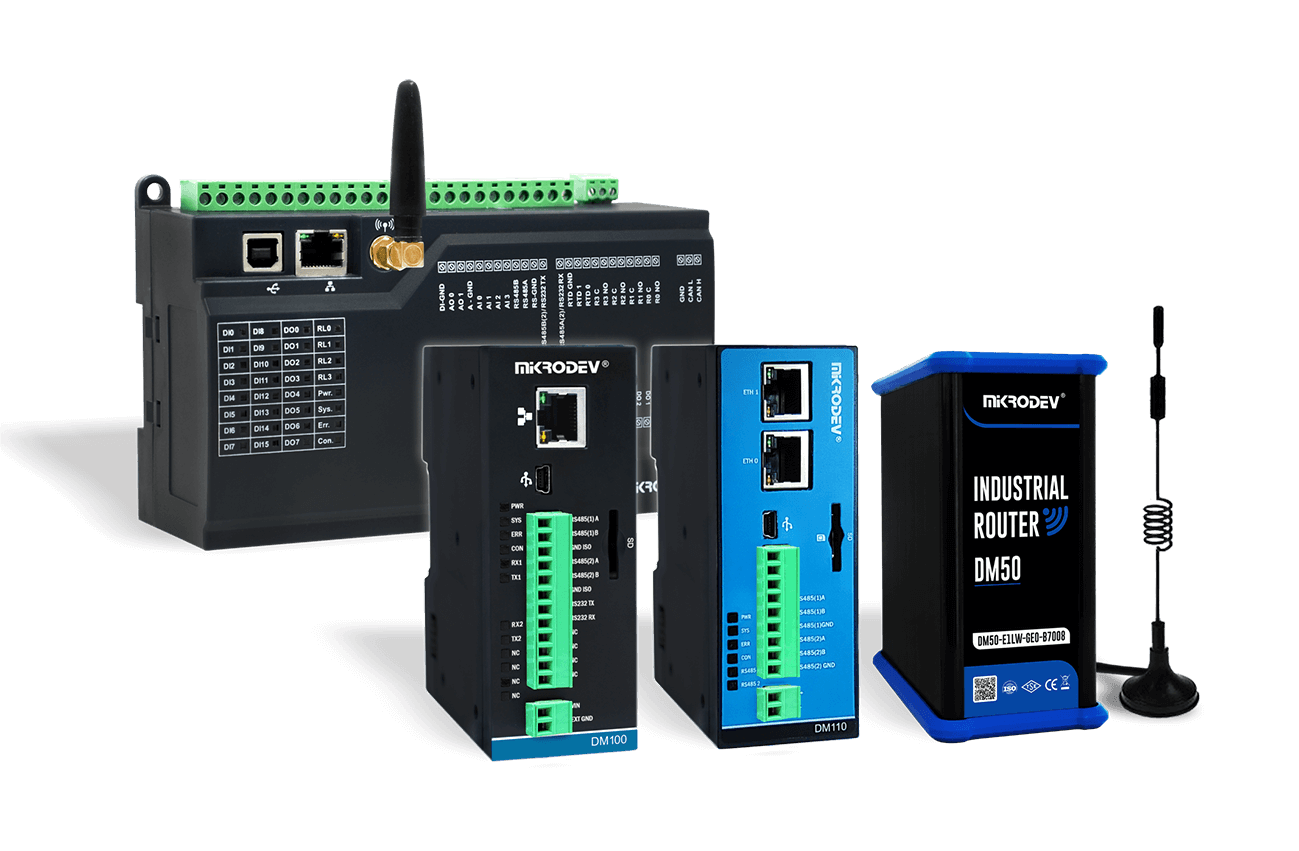
Multi-protocol and event-oriented devices on the RTU side accelerate integration. For example, using a unit designed for multi-protocol support and field conditions simplifies SCADA integration: DM100-E2N-GC3-B1000 RTU Device.
Role of RTU and PLC: Collection, Pre-processing, Event Tagging
The RTU or PLC collects, filters, and summarizes data from the field. It performs prioritization during periods of high data volume. If the network breaks, it writes to the buffer memory and sends in sequence when the connection is restored. Event tagging and sequence preservation solidify the root cause relationship and interruption analysis. Downsampling and 10-minute summaries reduce the load on SCADA and speed up reporting.
Data Model and Tagging: Unit, Scale, Location, and Measurement Class
A suggested consistent naming scheme: facility-line-transformer-device-channel. Mandate unit and scale fields; otherwise, incorrect graphs become inevitable. Add the following fields to the metadata: measurement class, CT/VT ratio, firmware version, calibration date, time synchronization source. This simplifies report verification during audits and accelerates fault analysis. To view the protocol, trend, and reporting options on the SCADA software side, examine this comprehensive catalog: ViewPLUS SCADA Integration.
Cyber Security and Time Sync: Secure and Accurate Data
-
Network Security: TLS, VPN, role-based access, session timeout, and audit trail.
-
OT-IT separation: Segmentation with DMZ, additional gateways for one-way data flow requirements.
-
Time Synchronization: NTP or PTP, possibly a GPS-redundant architecture. Alert thresholds and automatic correction plan for clock drift.
How to Bring Harmonic and Interruption Analysis to SCADA Screens?
The purpose on operator screens should be clear: perceive, classify, act. Use a heat map to color-code risky points. Read the time axis with trend and event lists. Maintain context with alarm layers in the single-line diagram. Compliance and reporting should function as the natural output of the screens.
Suggested KPI Set:
-
Harmonics: THD, individual harmonics (2-50), neutral current, and resonance indicators.
-
Interruptions: Number of events, total duration, average duration, indicators similar to SAIDI and SAIFI.
-
Compliance: 95th percentile and number of violations for parameters associated with EN 50160.
In alarm design, thresholds, hysteresis, and delay settings should be tiered according to the measurement class. Alarms coming from Class A measurements can be given higher confidence weight.
Harmonic Monitoring: Rapid Diagnosis with THD and Individual Components
THD alone provides an idea, but the root cause is often hidden in individual harmonics. 5th, 7th, and 11th harmonics are common in the industry. High values lead to problems like cable heating, transformer loss, and resonance with capacitive compensation. Detect the anomaly with a spectrum graph, then generate action recommendations:
-
Perform phase load distribution.
-
Check reactive compensation stages.
-
Plan passive or active filters if necessary.
Issues like sampling and sensor bandwidth on the field side affect THD accuracy. It is useful to review these technical notes when selecting a measurement device.
Interruption Analysis: Correct Classification of Sag, Swell, and Interruption
Event classes are separated by simple thresholds:
-
Sag (dip): Voltage below 0.9 pu.
-
Swell (rise): Voltage above 1.1 pu.
-
Interruption: Voltage below 0.1 pu.
The impact zone, duration, and depth provide clues for the root cause. For example, short and shallow sags can be associated with motor starting. Long and deep interruptions are an indicator of a common fault on the supply side. The SAIDI and SAIFI logic aggregates the duration and frequency of interruptions per unit consumer. A short report example would be the daily number of events and total minutes. A long report would be the monthly worst 10 locations and 95th percentiles.
Alarm and Event Management: Reduce Noise, Accelerate Action
-
Hysteresis, minimum duration, and re-alarm delay smooth the noise.
-
Event correlation groups sequential alarms on the same line. The operator intervenes from a single source.
-
The workflow extends from alarm to work order, field feedback, and closure note. Performance does not improve until this chain is closed.
-
Telemetry and event-based transmission reduce the SCADA load. DNP3 or IEC 61850 supported devices secure this process with sequence preservation and timestamping. For examples and technical details on field devices focused on SCADA and telemetry, this product page gives an idea: Programmable Unit for SCADA and Telemetry.
Reporting and Compliance: EN 50160-Based Summaries and KPIs
-
Monthly and weekly report templates should include trend graphs, 95th percentiles, and a list of the worst 10 locations.
-
Sharing should be possible via API, in addition to PDF and CSV.
-
For consistency in auditing, the measurement class, device ID, location, and calibration date should be added to the report appendix.
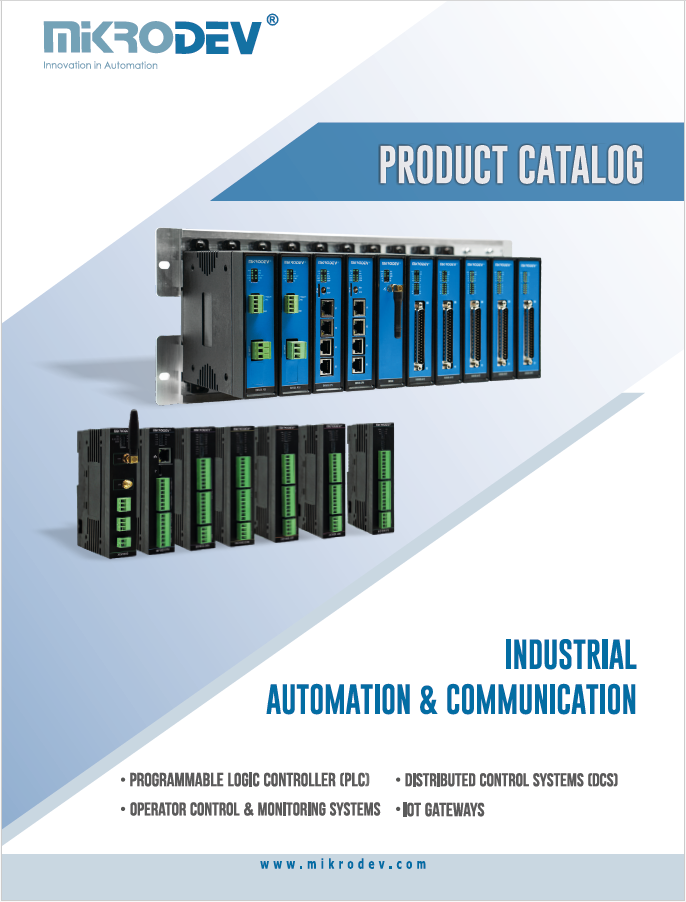
If you want to view the capabilities such as SCADA software and protocol support, reporting, and trend history all together, the comprehensive product catalog is at this link: Mikrodev Product Catalog 2023.
Step-by-Step SCADA Integration Plan and Test Scenarios
The roadmap relies on starting small and learning fast. The discovery, pilot, expansion, go-live, and maintenance phases should proceed with clear deliverables. Success metrics in each step must be numerical. IEC 61000-4-30 compliance and measurement class goals must not be overlooked during SCADA integration.
Preliminary Work: Requirements and Design Decisions
-
Parameter list: Voltage, frequency, harmonics, flicker, unbalance, events.
-
Sampling rate and retention periods: How long raw data will be kept, and how long 10-minute summaries will be archived.
-
Database size estimation: Calculation with point count, sampling, and retention policy.
-
Tag dictionary and naming: Facility-line-transformer-device-channel scheme.
-
Security and compliance requirements: Access roles, TLS, VPN, DMZ, audit trail.
If you want to examine the field and software product options in a single file, this document summarizing the protocol and RTU family facilitates the task: Mikrodev Product Catalog Download.
Pilot Istallation: Start Small, Learn Fast
A transformer or a critical line is the ideal pilot area. Success metrics should be clear:
-
Data loss rate below what percentage.
-
Alarm accuracy and unnecessary alarm rate.
-
Operator feedback, usability score.
At the end of the pilot, freeze the tag templates, threshold sets, and report formats. These standards must be repeated in the expansion phase.
System Test: Accuracy, Latency, and Data Integrity
-
Timestamp comparison: Look at the same event from different devices.
-
Comparison with a reference meter: Measure deviations against a Class A reference.
-
End-to-end latency: Measure the total delay from the device to the SCADA screen.
-
Network interruption simulation: Verify recovery from buffer and sequence preservation.
-
Alarm storm test: Threshold response to noise and SCADA stability.
In wide-area architectures, protocols like DNP3 that support event-based communication and sequence preservation provide robust results in latency and data integrity.
Go-Live and Sustainable Maintenance
-
Roll-out plan: Phased deployment by region, change management.
-
Activation of redundant architecture and disaster recovery drill.
-
Periodic calibration, software updates, training cycle.
-
KPI review: alarm noise, data loss, report completion rate.
After field deployment, this application document is valuable for example scenarios and integration approaches in different energy production types regarding the co-operation of the energy automation infrastructure with SCADA: Energy Automation with DM100 Series RTU.
Conclusion
With IEC 61000-4-30 compliant measurement, the correct measurement class selection, robust SCADA integration, and meaningful visualization, power quality data gains its true value. When harmonic and interruption analysis are combined with alarm and reporting, production losses decrease, the maintenance plan strengthens, and compliance is simplified. The quick action list: inventory, standardize tags and thresholds, launch a small pilot, run tests, automate reports, train the team. Identify a pilot area today and measure data quality; the small gains you achieve in the first week will build confidence. When you maintain the focus on power quality, PQ, harmonic, interruption analysis, SCADA integration, IEC 61000-4-30, and measurement class, your infrastructure becomes more reliable and readable.


 Water SCADA System")


 Energy Monitoring System")