
Pressure to reduce water losses in utilities increases every year. Moreover, the problem is not limited to water loss alone; energy costs, network lifespan, and field workload also rise simultaneously. For this reason, the approach of “we built DMA and monitor minimum night flow” is often insufficient by itself. Night flow may increase, but whether the cause is leakage, unusual consumption, or measurement error is often unclear.
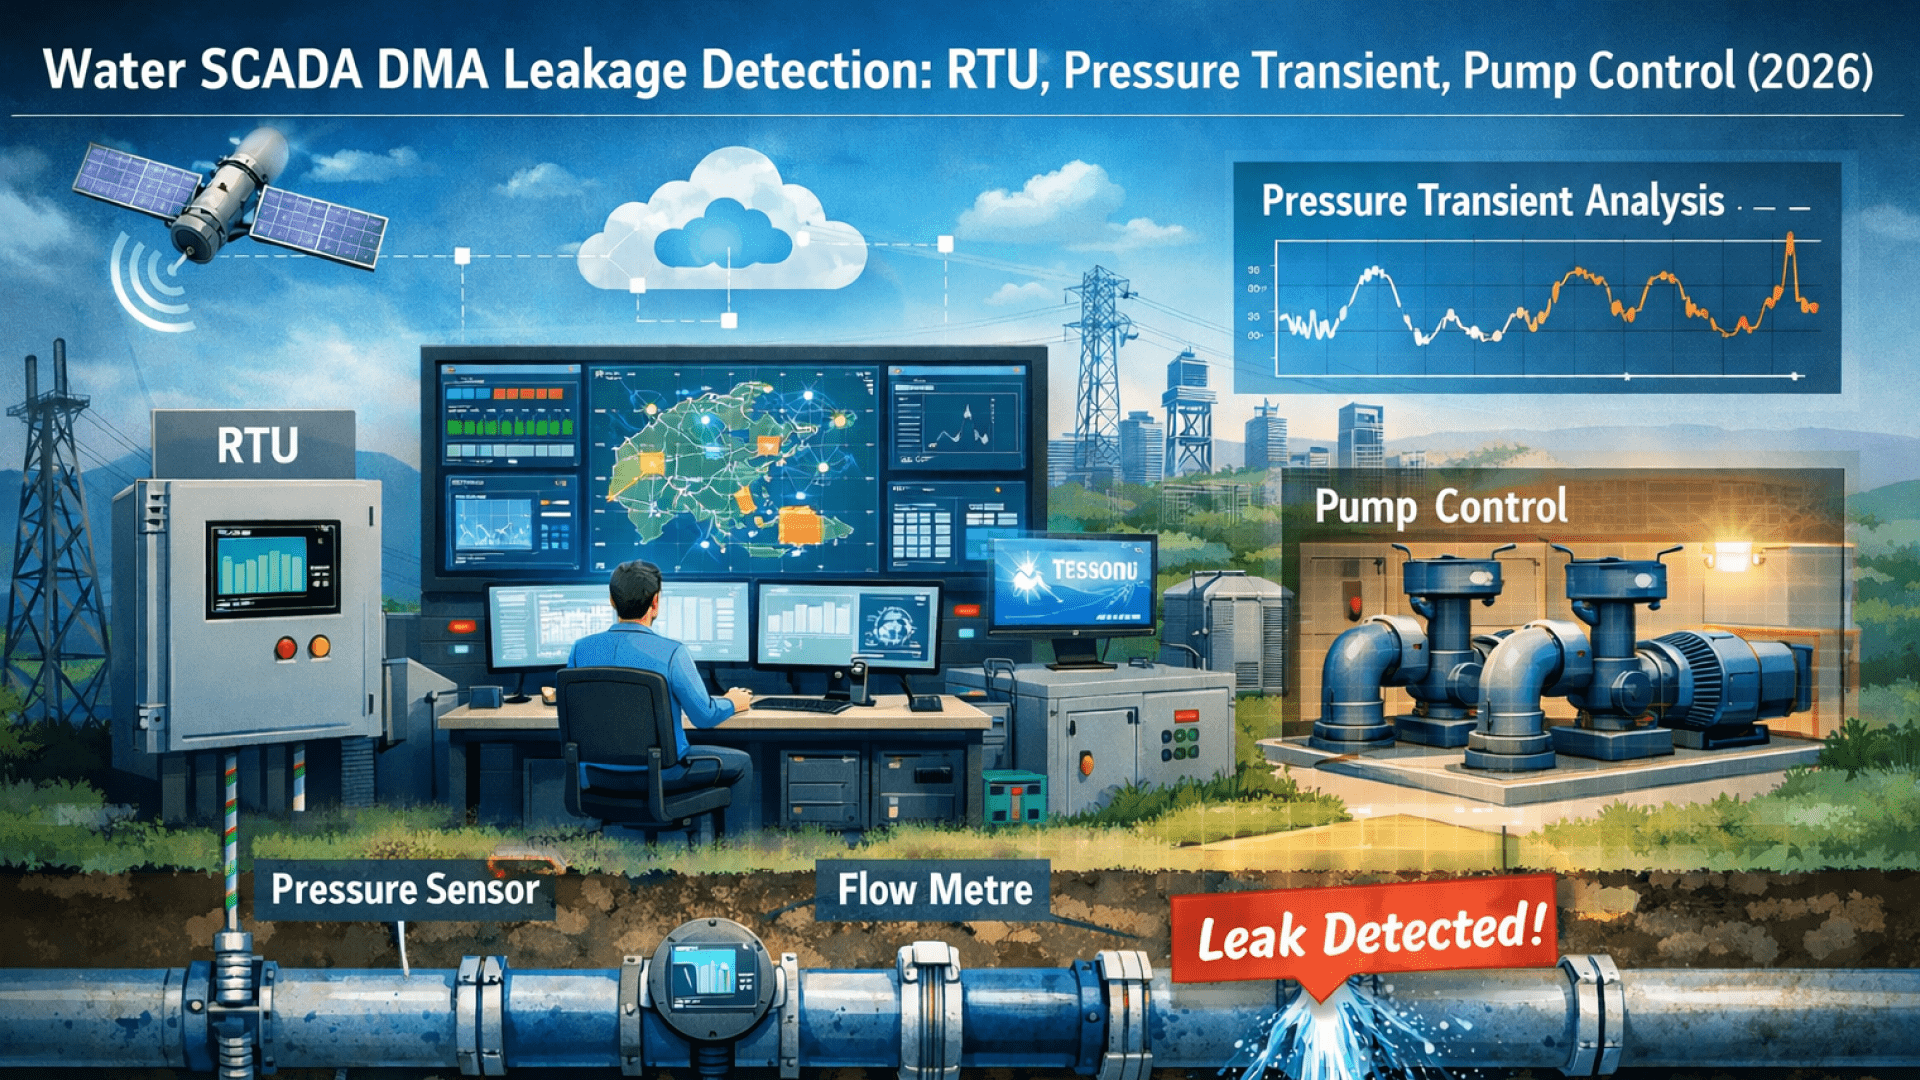
This is where Water SCADA comes into play. When flow and pressure data from RTUs are integrated on a single screen, you can analyze not only levels but also patterns of change. Short-term pressure fluctuations (pressure transients) leave small “signatures” for certain leak types. Although these may be missed in classical trend monitoring, they can be captured with proper sampling and event recording.
This article discusses DMA principles, critical RTU data acquisition settings, how pressure transient analysis reveals leaks, why pump control interaction matters, and a practical end-to-end workflow.
Which Data Is Essential in Water SCADA for DMA-Based Leak Detection?
DMA (District Metered Area) starts with a simple concept: divide the network into defined subzones, measure inflow (and outflows if any), and compare with expected consumption. The word “expected” is critical. Without reliable data, leak detection becomes an alarm-generation contest.
The minimum dataset generally includes: DMA inlet flow, at least one critical pressure point, reservoir outlet data (if applicable), and pump station operation status. Minimum Night Flow (MNF) remains useful, as leaks are more visible during low consumption. However, relying solely on MNF is misleading, especially in tourist areas, industrial shifts, or regions with night irrigation.
For pressure transient analysis, sampling rate is decisive. Fifteen-minute or even one-minute pressure data smooths fast events such as valve closures or pump starts, making transients invisible. As detection focuses on smaller leaks, capturing short-term variations becomes increasingly important.
Three data-quality factors usually determine project success:
- Time synchronization
- Tagging and unit consistency
- Alarm fatigue
DMA Design, Measurement Points, and the “Correct Comparison” Problem
Defining DMA boundaries is more than drawing polygons on a map. Ideally, inflow should be measured at a single point. Multiple inlets require accurate aggregation. Uncontrolled bypasses or open valves weaken DMA integrity.
On the pressure side, the “critical point” is usually the lowest service-pressure location rather than the highest elevation. Leak and control issues appear there first.
Distinguishing leakage from consumption is rarely straightforward. Weekly patterns, holidays, hydrant use, and industrial night shifts distort profiles. Therefore, comparisons should be based on similar day clusters rather than single days.
A practical starter checklist:
- Flow: at DMA inlet(s)
- Pressure: at least one, ideally two points
- Initial setup: 1 flow + 2 pressure sensors
Field Data Acquisition with RTUs: Sampling, Time Stamps, and Interruption Management
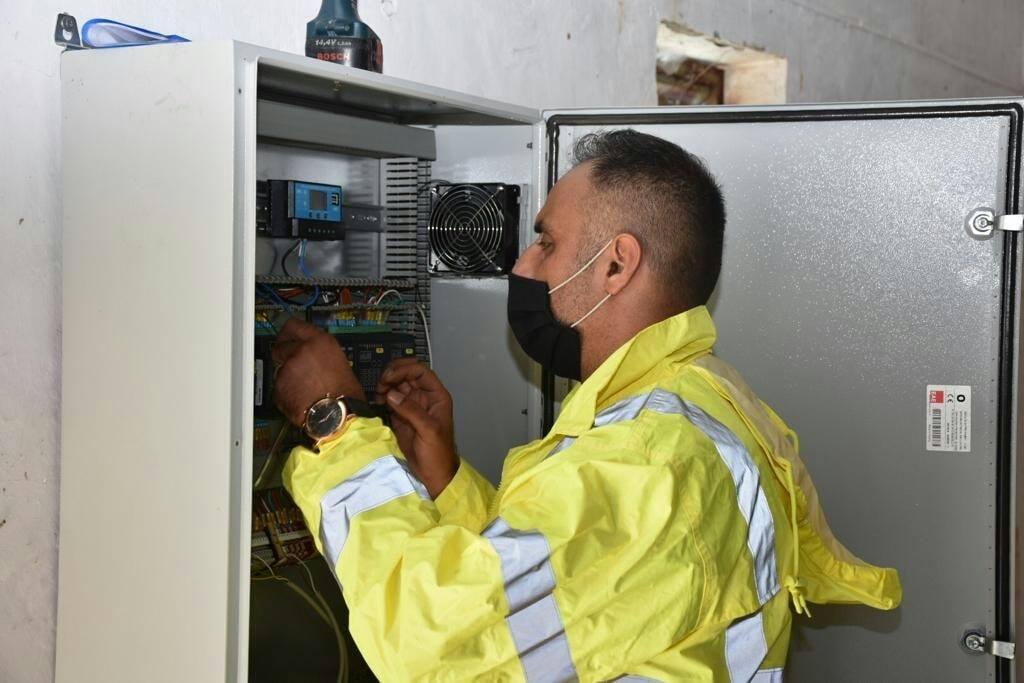
RTUs are the memory of field data acquisition. They read pressure transmitters, flow meters, and sometimes manage power.
To capture transients, typical sampling ranges from 1–10 Hz. Event-based “burst recording” is effective: normally 1 Hz, switching to high speed when sudden changes occur.
Communication failures are reality. GSM outages and power fluctuations make store-and-forward functionality critical. Missing data often means missing the transient itself.
Time synchronization via NTP or GPS is a key quality criterion, especially for multi-point analysis.
How Pressure Transient Analysis Reveals Leaks
Pressure transients are rapid pressure rises and drops propagating through the network. During low consumption (e.g., at night), their signatures are easier to detect.
Common causes include valve closures, pump starts/stops, major consumption changes, and PRV adjustments. These create pressure waves that propagate and attenuate.
Leaks increase energy loss. They may accelerate damping, distort wave shapes, or cause amplitude differences. Leaks do not simply “reduce pressure”; they modify wave behavior.
The most reliable approach is correlating transients with flow and pressure trends. A short transient may not immediately increase flow, but persistent pressure drops and shifted night flow indicate leakage.
Leak Signatures: Repeating Patterns, Damping, Asymmetry, and Anomaly Windows
Operators do not see “leak labels,” only clues:
- Repeated minor pressure drops
- Faster-than-normal damping
- Unexpected amplitude differences
- Waveform asymmetry
A practical method:
- Build 4–6 week reference profiles
- Define deviation thresholds
- Scan transient windows using simple metrics (RMS, peak-to-peak, minima)
False positives must be considered: air pockets, PRV hunting, pump ramps, sensor issues.
Field Realities of Leak Localization: Sensor Spacing, Velocity Assumptions, Verification
Expecting meter-level accuracy is unrealistic. Wave velocity varies by pipe material, diameter, and temperature.
With two pressure points, time difference analysis provides approximate locations. This narrows search zones significantly.
Final confirmation requires acoustic logging, correlators, step testing, or sectional valve closures.
End-to-End Workflow on RTU and Water SCADA: From Alarm to Field Dispatch
Effective systems combine analysis with workflow:
- Asset tagging and inventory
- Reference thresholds
- Event detection
- Operator review
- Automatic reporting
- Field validation and closure
Combining transient detection with DMA deviation greatly improves alarm quality.
Three screens are usually sufficient: trends, event list, and map.
Key KPIs: detection time, validation rate, site visits per alarm.
Event-Based Recording and Alarms: “Signal First, Interpretation Later”
Event-based recording is central to transient detection.
RTU triggers may include pressure drops, dP/dt thresholds, or peak-to-peak growth. Pre-buffering ensures event start is captured.
Two-stage alarms are recommended:
- Transient detected (informational)
- Persistence verified (true alarm)
Alarm messages should be action-oriented, including suggested checks and trend links.
Pump Control and Transient Management: Stabilizing the System Without Interference
Pump operations are major transient sources. Frequent starts/stops and aggressive VFD ramps intensify pressure fluctuations.
Leak detection systems must recognize planned operations to avoid false alarms.
Mitigation methods (soft starts, longer ramps, stable PRV settings) improve both system reliability and detection accuracy.
Clean signals mean fewer field visits and faster validation.
Conclusion
Starting with DMA is correct, but real differentiation comes from proper data and recording behavior. Integrating RTU flow and pressure data with event-based transient capture makes even small leaks visible.
Best results come from correlating transients with DMA deviations and persistent pressure changes while accounting for pump control.
Next steps:
- Select a pilot DMA
- Install 2 pressure points + inlet flow
- Collect 4–6 weeks of reference data
- Gradually activate thresholds and alarms
The goal is measurable: faster detection and fewer unnecessary field inspections.